Key Takeaways
- Trump tariffs are the largest US tax increase as % of GDP since 1993, averaging $1,500 per household.
- Supreme Court struck down IEEPA basis (6-3), forcing pivot to Section 232 at 10% baseline.
- US-China trade deficit barely changed despite record-high tariffs.
- Iran war oil shock creates dual inflationary pressure heading into April 2026.
- Vietnamese exporters face an estimated $14.5 billion tariff burden on US-bound goods.
The $1,500 Household Burden
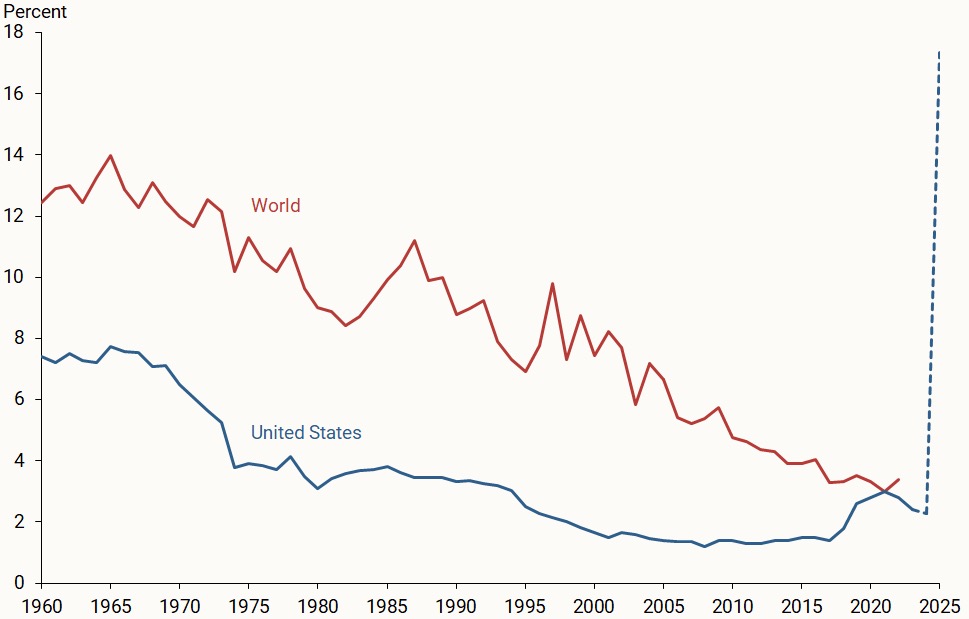
According to the Tax Foundation, Trump tariffs represent the largest US tax increase as a percentage of GDP since 1993. With the highest tariff rates since World War II, the average cost to each American household rises by an additional $1,500 per year in 2026. This figure encompasses increased consumer prices on everything from electronics to clothing and imported food products.
Goldman Sachs estimates that tariffs alone caused inflation to rise 0.5 percentage points in 2025. JPMorgan reports that 80% of businesses initially absorbed tariff costs, but this figure is expected to drop sharply to just 20% in the second half of 2026. As businesses begin passing costs through to consumers, the actual burden may significantly exceed the $1,500 estimate.
For context, $1,500 per household annually is roughly equivalent to 38 million VND, nearly one month of average salary in Vietnam.
Supreme Court Ruling: IEEPA Cannot Authorize Tariffs
On February 20, 2026, the US Supreme Court ruled 6-3 that the International Emergency Economic Powers Act (IEEPA) does not authorize the president to impose tariffs. This represents the most significant legal turning point in US trade policy since the 1930s. The ruling established that IEEPA only permits financial measures such as asset freezes and economic sanctions, not trade barriers.
The ruling forced the Trump administration to rapidly find alternative legal authority. Within weeks, the invalidated IEEPA tariffs were replaced with new tariffs under Section 232 (national security) and the Trade Act of 1974. While the legal basis changed, the protectionist trade policy objectives remained intact.
For exporters to the US, this ruling created a brief legal gap, but replacement tariffs filled it almost immediately, leaving virtually no duty-free window.
Tariff Policy Timeline
Trump used the International Emergency Economic Powers Act to impose sweeping tariffs, the highest US trade barriers since WWII.
The Supreme Court ruled that IEEPA does not authorize tariffs, forcing the administration to find alternative legal authority.
Administration pivoted to Section 232 (national security) and Trade Act of 1974, imposing a 10% baseline tariff.
Iran war oil price shock compounds with tariffs, creating dual pressure on consumer prices heading into Q2.
Section 232: The 10% Replacement Tariff
Following the Supreme Court ruling, the administration pivoted to Section 232 of the Trade Expansion Act of 1962 and the Trade Act of 1974 to maintain tariffs. A 10% baseline tariff was applied broadly, with certain sectors facing higher rates. The Tax Foundation estimates that Section 232 tariffs alone will reduce long-run US GDP by 0.2%.
Notably, Section 122 of the Trade Act of 1974 permits a maximum tariff of 15% for 150 days. This cap means that if the administration wants to maintain higher rates, it needs to continuously renew authority or find additional legal basis. This creates policy uncertainty that makes long-term business planning extremely difficult.
Vietnamese businesses exporting to the US should closely monitor the 150-day Section 122 deadline, as rates may change abruptly upon expiration.
Trade Flow Analysis: Are Tariffs Working?
Data reveals a surprising picture: despite the US imposing the highest tariffs since World War II, both US imports and Chinese exports hit all-time highs in 2025. Global trade continued to grow faster than the world economy. According to the Peterson Institute for International Economics (PIIE), tariffs have not meaningfully altered the trade deficit.
Trade flows have been rerouted through intermediary countries, particularly Vietnam, Mexico, and India. Chinese goods are often shipped through these countries before reaching the US, with minimal processing to avoid direct tariffs. This explains why the overall deficit has barely changed, even as the bilateral deficit with China appears to narrow.
Vietnam has become the largest intermediary, with US-bound exports surging. However, the US is tightening origin verification, threatening this transshipment model.
Iran War Oil Shock: Dual Inflationary Pressure
Heading into April 2026, the US and global economy faces dual inflationary pressure: tariffs pushing up import prices, while the Iran conflict creates an oil price shock. This combination is particularly dangerous because they affect different but reinforcing inflation channels, from transportation costs to manufacturing inputs to final consumer goods.
JPMorgan warns that the 80% of businesses currently absorbing tariff costs will drop to just 20% in the second half of 2026. This means a major cost pass-through wave is coming just as energy prices surge from the Iran conflict. Consumers will feel two price shocks nearly simultaneously.
If you commute daily in Vietnam, rising fuel prices from the Iran conflict combined with tariff-driven import price increases could add 200,000-500,000 VND to monthly living costs.
Impact on Vietnamese Exports
With the 10% baseline tariff applied broadly, Vietnamese exports to the US face an estimated $14.5 billion tariff burden. The four most affected sectors are electronics ($6.5B), textiles ($4.4B), footwear ($2.4B), and agriculture ($1.2B). This is ZestLab's analysis based on 2025 export data and Section 232 rates.
Tariff Impact on Vietnamese Exports
ZestLab analysis: Estimated based on 10% Section 232 baseline tariff
| Sector | US Exports ($B) | Tariff Rate | Tariff Cost ($B) |
|---|---|---|---|
| Textiles | $44B | 10% | $4.4B |
| Footwear | $24B | 10% | $2.4B |
| Electronics | $65B | 10% | $6.5B |
| Agriculture | $12B | 10% | $1.2B |
| Total | $145B | 10% | $14.5B |
If you work in Vietnam's textile export sector, a 10% tariff means every $10,000 order faces an additional $1,000 tax cost, potentially causing US buyers to shift to alternative suppliers.
Household Tariff Cost Estimator
Tariff Cost Calculator
Enter your annual household income (USD) to estimate your tariff burden. Based on Tax Foundation research, the average tariff increase is $1,500 per household at median income of $75,000.
ZestLab analysis based on Tax Foundation data, March 2026
April 2026 Outlook: What Comes Next?
US tariff policy is at a critical juncture. Section 122 only permits a maximum 15% tariff for 150 days, meaning some rates will expire by summer 2026 unless renewed. Meanwhile, additional lawsuits are pending in federal courts that could further narrow presidential tariff authority.
Key factors to watch: (1) Whether Congress passes new tariff authorization legislation to replace IEEPA, (2) Trade partner responses, particularly from China and the EU, (3) Q2 inflation data that will reveal the real impact of businesses passing tariff costs to consumers.
If you work in import-export, prepare contingency plans for both scenarios: tariffs being renewed or reduced after the 150-day window.
References
- Tax Foundation — Trump Tariffs: Tax and Economic Impact of the Trump Trade War
- CNN Business — Tariffs and Prices: What Americans Will Pay in 2026
- Euronews — The Biggest Winners and Losers of the Tariff War
- PIIE — US-China Trade Deficit Analysis, March 2026
- Goldman Sachs — Tariff Inflation Impact Report, 2025